General Tools
FHIR (Fast Healthcare Interoperability Resources)-to-CDE Tool
The data dictionary includes a FHIR-to-CDEs tool that ensures compatibility between clinical research data and FHIR profiles. This mapping enables the seamless integration of clinical data collected via FHIR-compliant systems into the BRICS ecosystem, ensuring a streamlined flow of standardized data between healthcare and research systems.
FHIR-to-CDE Tool
CDISC-to-CDE Tool
The BRICS Data Dictionary also includes a CDISC-to-CDE tool, which implements the Study Data Tabulation Model Implementation Guide (SDTMIG) to guide users on the organization, structure, and format of standard clinical study tabulation datasets, using the BRICS Platform. This also enables BRICS to support seamless data exchange between SDTMIG-compliant systems and BRICS, or submission to a regulatory authority, such as the US Food and Drug Administration (FDA).
Launch CDISC-to-CDE Tool
UMLS (Unified Medical Language System)
The BRICS data dictionary incorporates a mapping tool that links UMLS concepts to BRICS CDEs. This integration allows users to leverage UMLS’s vast repository of medical terminologies and concepts, ensuring alignment between clinical research data and standard medical terminologies, further enhancing data interoperability and accuracy.
Launch Data Element to UMLS Mapping Tool
AIMS4DE: Artificial Intelligence Meaningful Search for Data Elements (Beta Version)
The FITBIR Instance of the BRICS data dictionary includes a Beta version of an AI semantic (meaningful) search tool for cross-mapping new study variables to previously used and standardized data elements stored in the FITBIR data dictionary. The semantic search tool employs a large language model to convert text to a numerical representation, so unlike a traditional keyword-matching search, this algorithm enables the user to search the data element dictionary based on the phrase’s meaning, regardless of spelling. Note that this is a beta version of the tool, which is currently only available for the FITBIR BRICS instance. The BRICS team is working to incorporate this tool more seamlessly into the current data dictionary search interface and has plans to potentially release similar tools for other BRICS instances. If you have questions, comments, or suggestions regarding your user experience or research needs, please don’t hesitate to contact maria.bagonis@nih.gov.
Launch AI CDE Mapping Tool
BRICS Data Discovery
The BRICS Data Discovery Tool is an interactive tool for exploring all BRICS instances simultaneously in one shared visualization. Compare and contrast studies, form structures, and data elements across BRICS instances and search for commonality. Create cohorts of participants for specific form structures or data elements, then filter cohorts by age and gender to dive down and find data. Data elements are linked by UMLS codes for more comprehensive search.

Visualization: Multidimensional
The Parallel Coordinates Plot interactive tool is used for data analysis and exploration. It is specifically designed to display data sets with many variables, enabling the researcher to discover interesting relationships between those variables. This type of visualization is used for plotting multivariate, numerical data.
The Movement Disorders Society-Unified Parkinson's Disease Rating Scale (MDS-UPDRS) was developed to evaluate various aspects of Parkinson’s disease including non-motor and motor experiences of daily living and motor complications. This visualization shares relationships between MDS-UPDRS data, age and diagnosis at baseline.

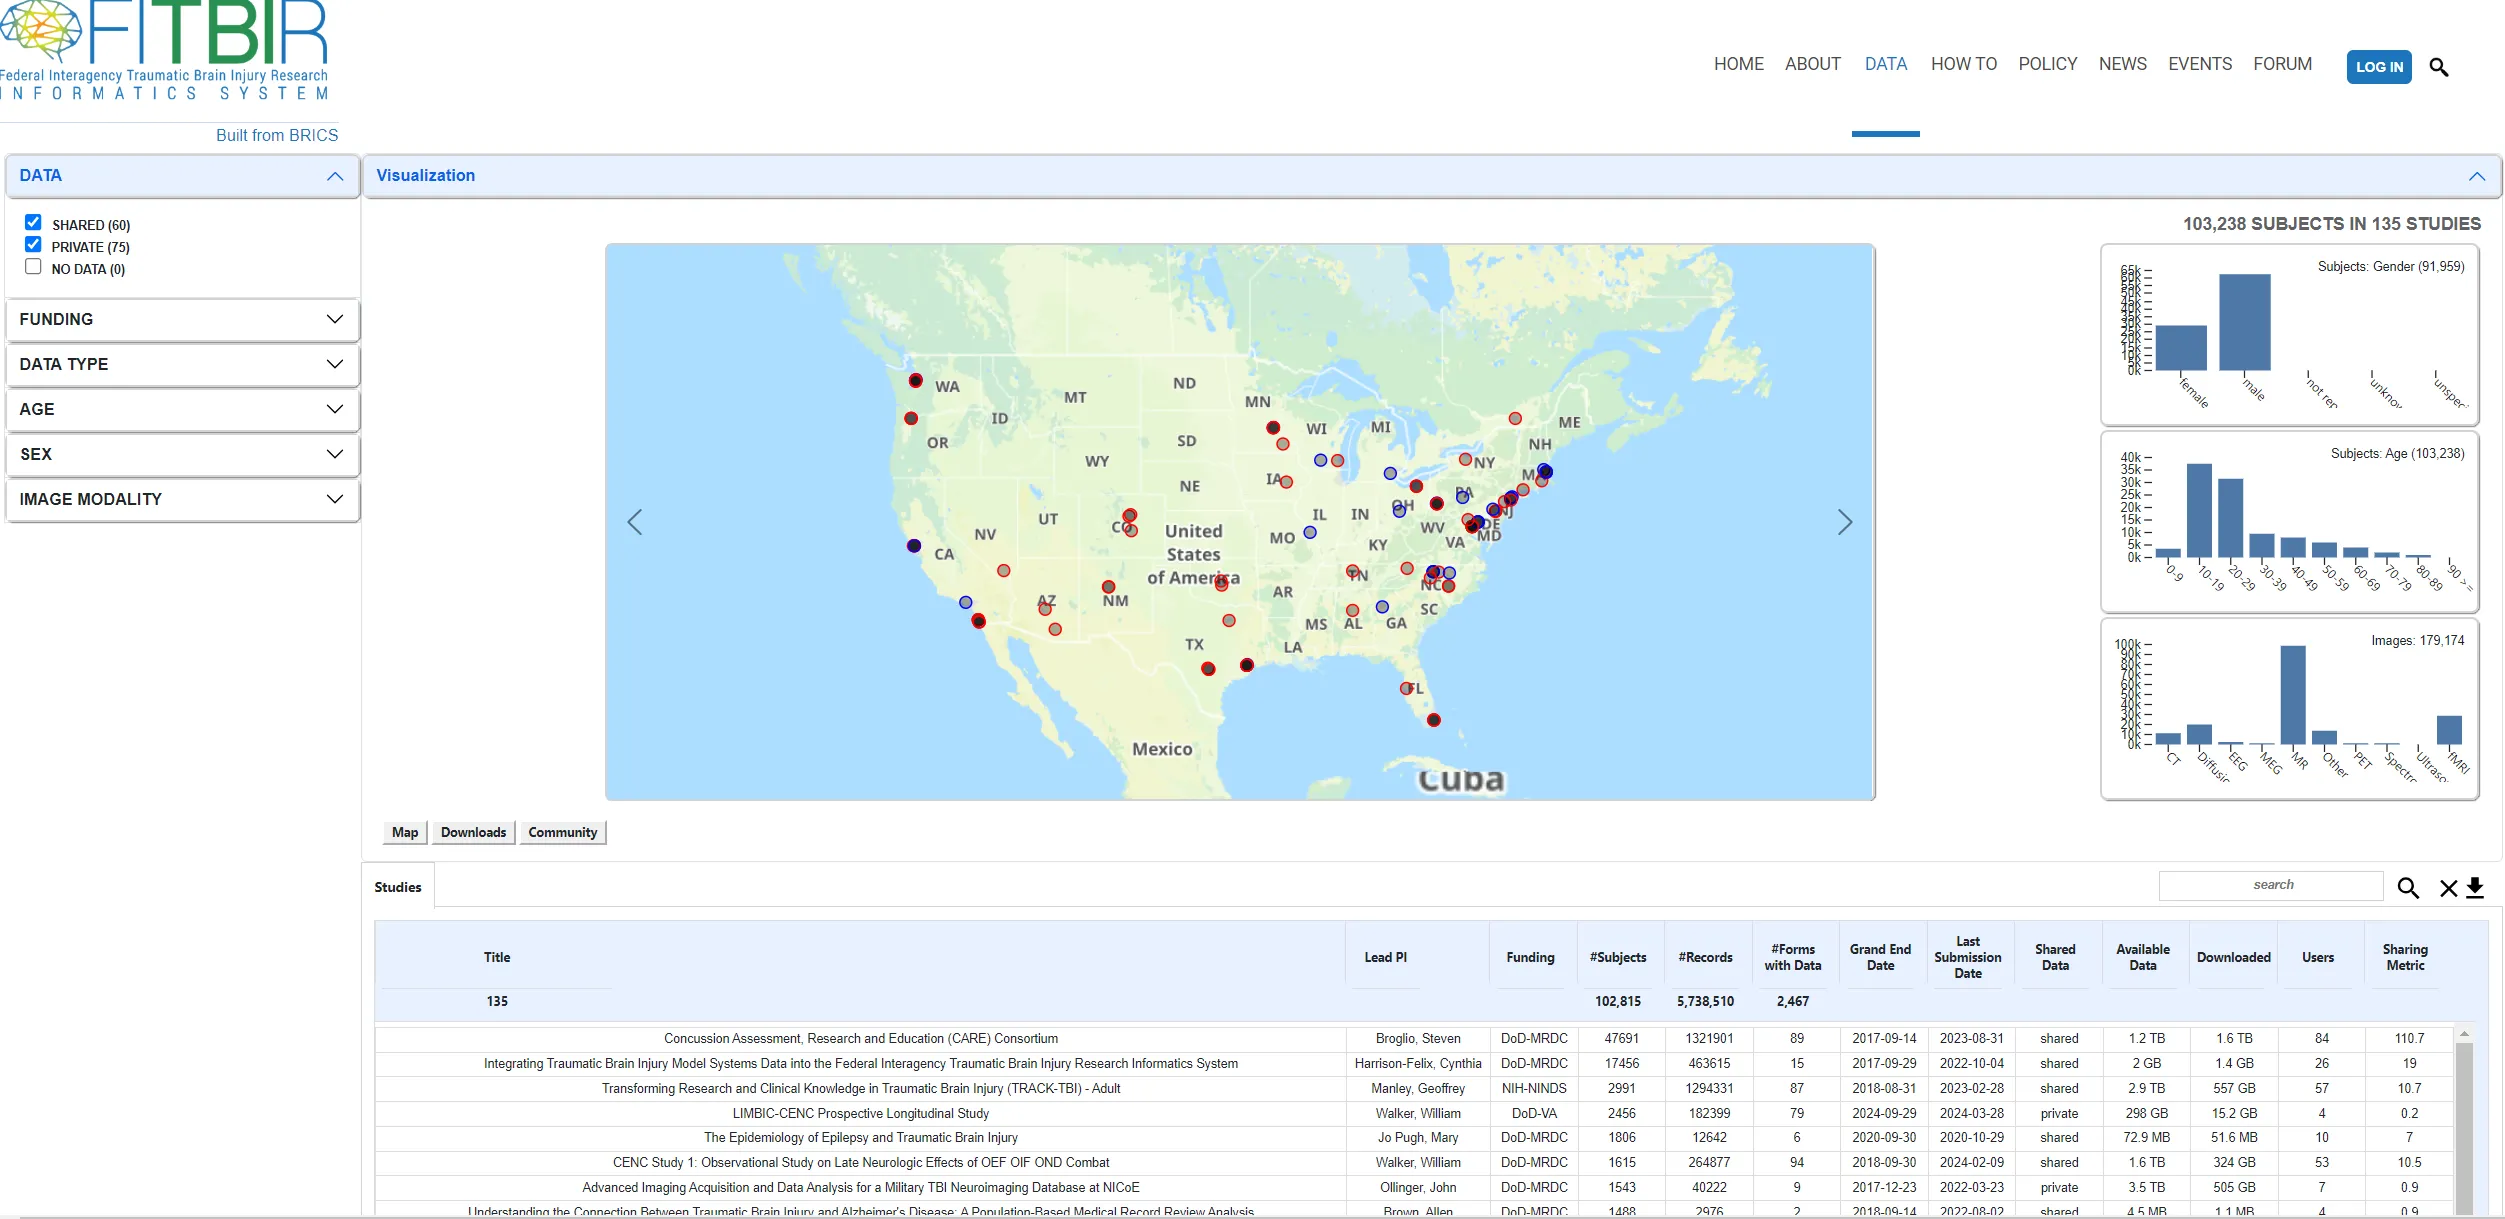
Visualization: Hierarchial
Chord Diagrams visualize the inter-relationships between entities. The connections between entities are used to display that they share something in common. This makes Chord Diagrams ideal for comparing the similarities within a dataset or between different groups of data. Nodes are arranged along a circle, with the relationships between points connected to each other either through the use of arcs or Bézier curves. Values are assigned to each connection, which is represented proportionally by the size of each arc. Color can be used to group the data into different categories, which aids in making comparisons and distinguishing groups. For each study within FITBIR with “shared” datasets, you can see the relationship between the number of users and the amount of data downloaded from the system.
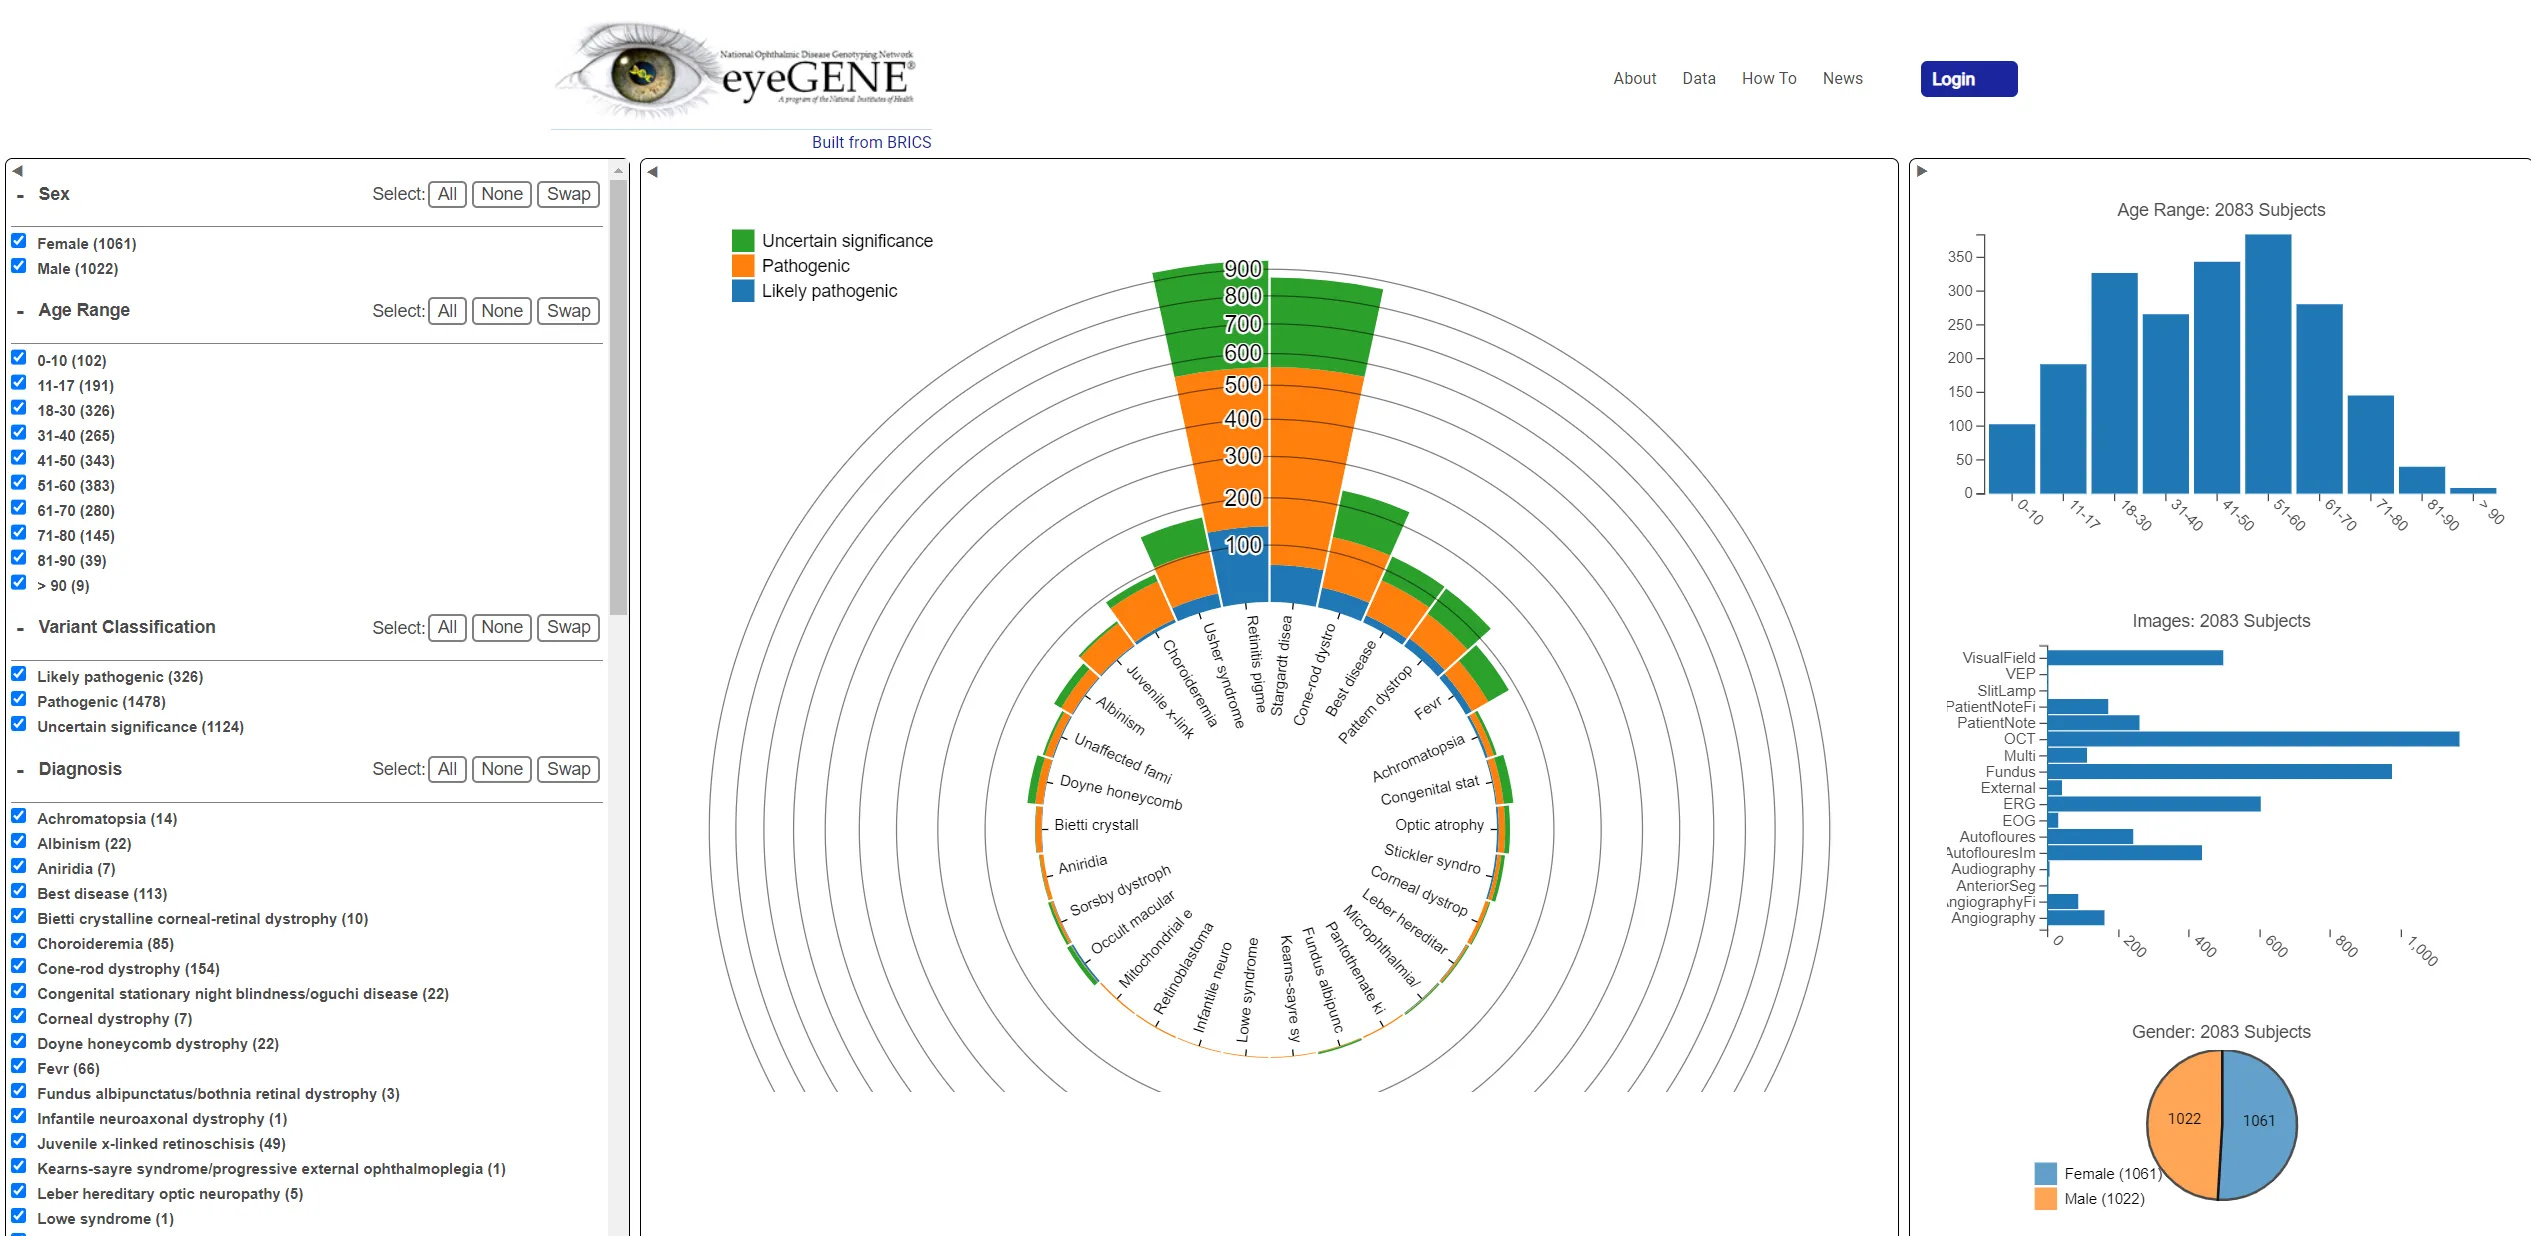
Visualization: Multidimensional
Interactive visualization tool for eyeGENE at NEI.