BRICS Data Discovery
The BRICS Data Discovery Tool is an interactive tool for exploring all BRICS instances simultaneously in one shared visualization. Compare and contrast studies, form structures, and data elements across BRICS instances and search for commonality. Create cohorts of participants for specific form structures or data elements, then filter cohorts by age and gender to dive down and find data. Data elements are linked by UMLS codes for more comprehensive search.

Visualization: Multidimensional
The Parallel Coordinates Plot interactive tool is used for data analysis and exploration. It is specifically designed to display data sets with many variables, enabling the researcher to discover interesting relationships between those variables. This type of visualization is used for plotting multivariate, numerical data.
The Movement Disorders Society-Unified Parkinson's Disease Rating Scale (MDS-UPDRS) was developed to evaluate various aspects of Parkinson’s disease including non-motor and motor experiences of daily living and motor complications. This visualization shares relationships between MDS-UPDRS data, age and diagnosis at baseline.

Visualization: Hierarchial
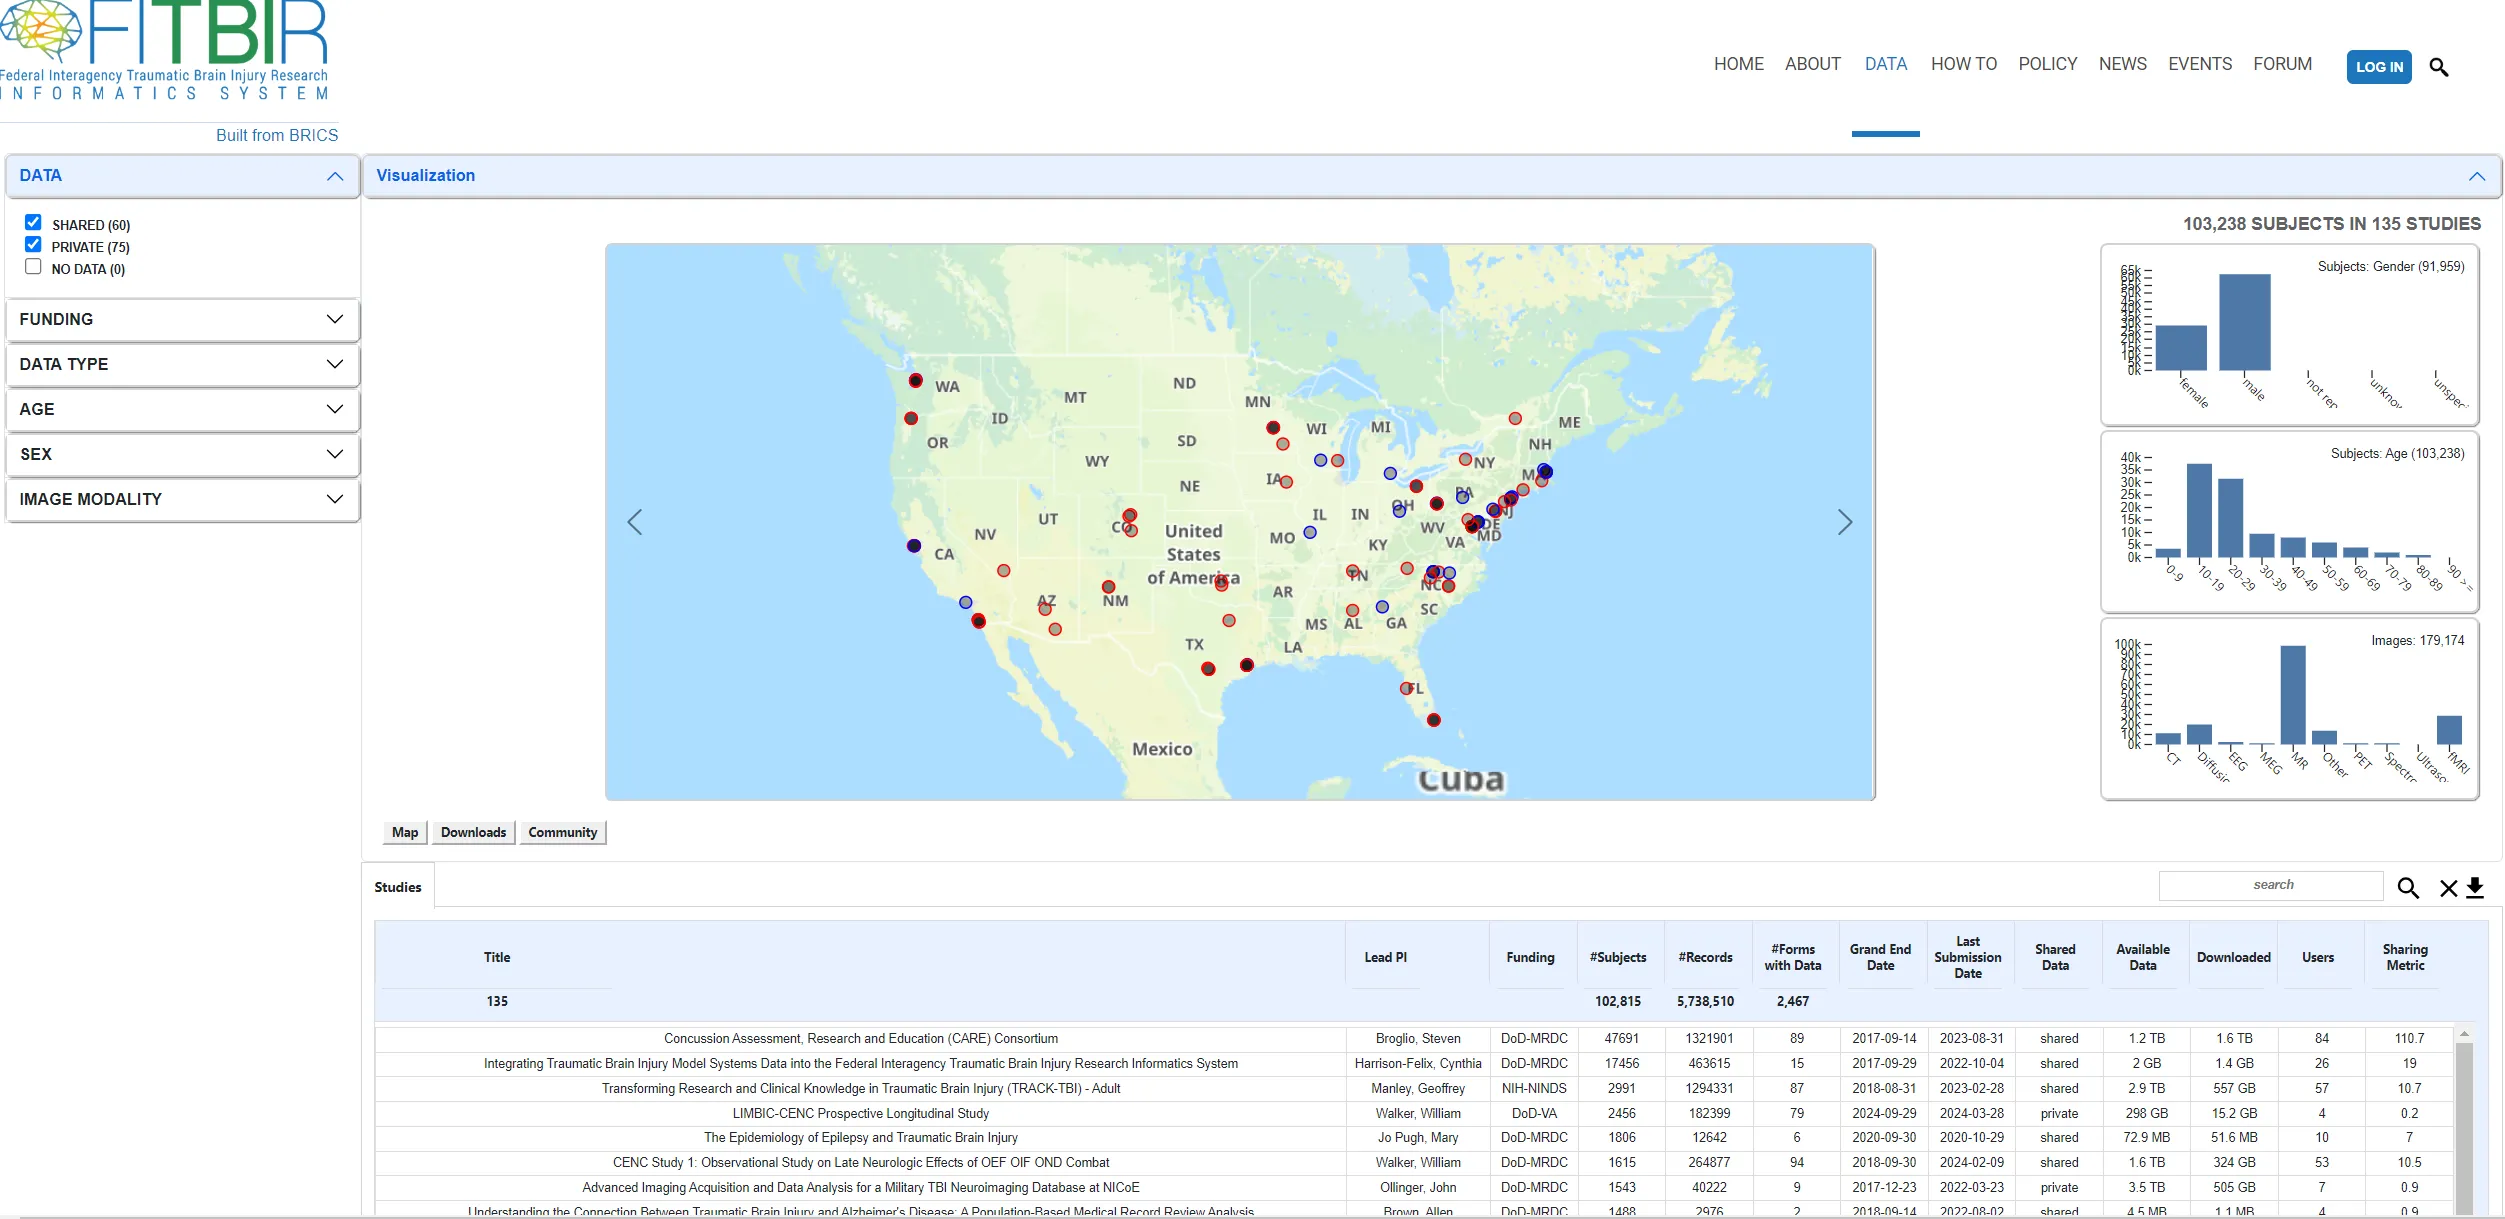
Chord Diagrams visualize the inter-relationships between entities. The connections between entities are used to display that they share something in common. This makes Chord Diagrams ideal for comparing the similarities within a dataset or between different groups of data. Nodes are arranged along a circle, with the relationships between points connected to each other either through the use of arcs or Bézier curves. Values are assigned to each connection, which is represented proportionally by the size of each arc. Color can be used to group the data into different categories, which aids in making comparisons and distinguishing groups. For each study within FITBIR with “shared” datasets, you can see the relationship between the number of users and the amount of data downloaded from the system.
Visualization: Multidimensional
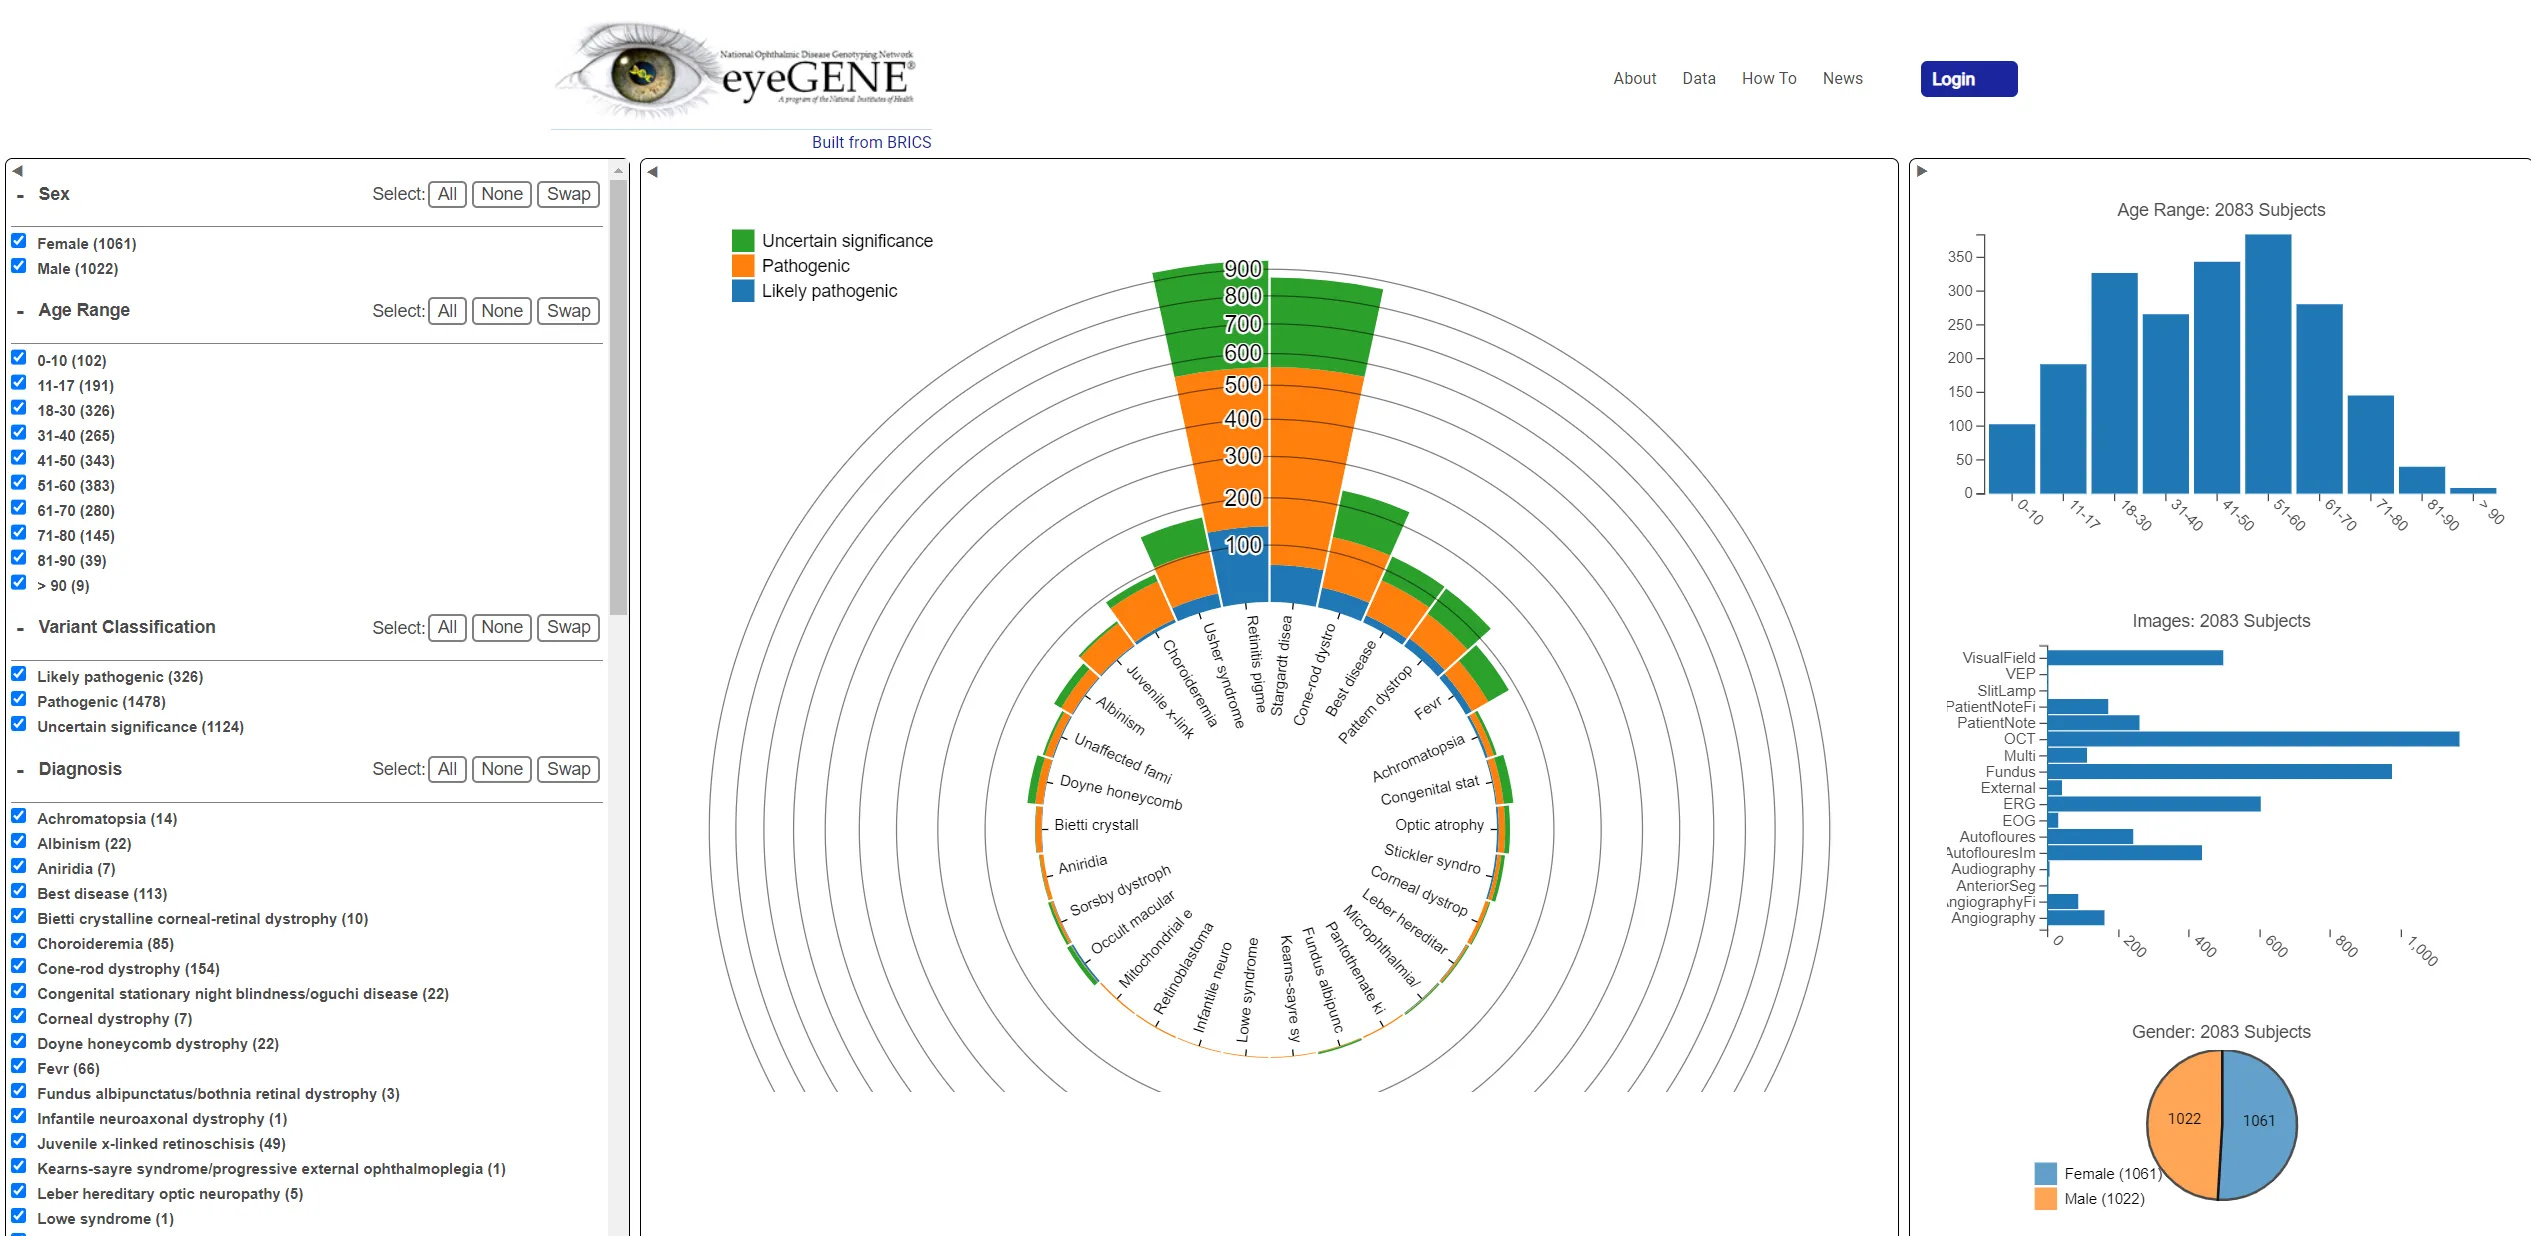
Interactive visualization tool for eyeGENE at NEI.